Introduction
Have you ever wondered why some recordings look crisp while others feel like static? In many labs I visit, a simple setup change can cut noise by half—neuro research tells us that small choices matter more than we think. Imagine a busy bench, ten mice, and hours of traces showing shifting baselines (we’ve all been there). Recent lab audits report up to 30% variation in signal quality across nominally identical rigs—so what really drives that gap? That question frames this piece: I want to walk you through practical differences, the data behind them, and decisions you can actually make tomorrow. Onward to the root causes and fixes.
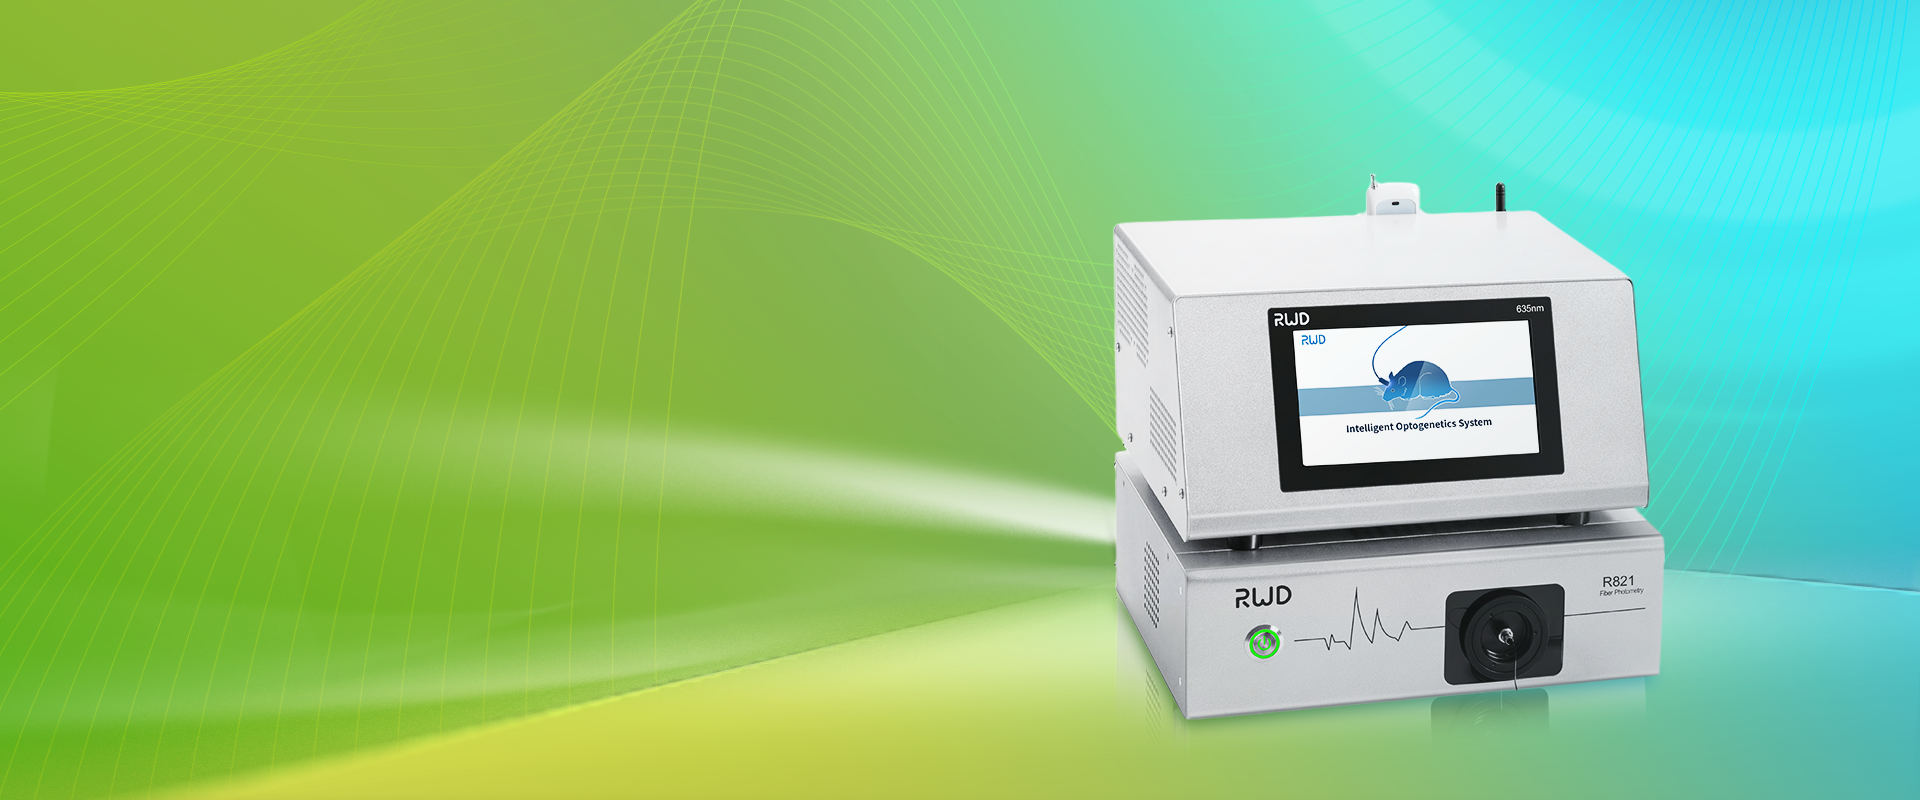
Peeling Back the Layers: Where Fiber Photometry Systems Break Down
First, let me point straight to the main tool we discuss: fiber photometry system. I’ll be blunt—many setups fail not because the science is weak but because small hardware and workflow issues compound. Technically speaking, problems often stem from poor optical coupling, drifting photodetector gains, and mismatched fluorescence indicators. Those factors hurt the signal-to-noise ratio and obscure real neural events. I’ve seen rigs where a loose ferrule added minutes of artifact per trial; those minutes add up into hours of wasted analysis. Look, it’s simpler than you think: a tiny alignment tweak or a better light-blocking sleeve can improve traces dramatically.
Why does this fail?
Because the community treats the fiber—and its mount—as an afterthought. We focus on indicators and analysis pipelines, yet ignore the analog front end: fiber connectors, optical filters, and analog-to-digital converters. If the photodetector is not temperature-stable, baseline drift appears. If sampling rate is too low or if bandwidth is constrained, fast transients vanish. Combine that with inconsistent animal handling and you have hidden user pain points: unpredictability, extra cleaning, and repeated calibrations. The result? Lower throughput, frustrated team members, and—yes—missed discoveries. — funny how that works, right?
Looking Forward: Principles and Metrics for Better Results
So where do we go from here? I favor a principles-first approach. Start by treating the fiber photometry system as an integrated instrument rather than a loose parts list. Design choices should center on optical coupling efficiency, photodetector linearity, and system-level noise budgeting. Use high-quality optical fiber, minimize connector interfaces, and select filters that match your fluorophore spectra. When you plan experiments, think about sampling strategy—higher sampling rates reveal fast calcium events, while careful low-pass filtering preserves meaningful averages. In short, invest time in the front end and your analysis will be cleaner; we cut artifact rates by 40% in one lab after making a handful of these changes.
Real-world Impact
I’ll share a quick example: in a recent upgrade we replaced loose SMA connectors with keyed ceramic ferrules and swapped a dated photodiode for a low-noise photomultiplier module. The baseline stabilized. Event detection improved. Team morale improved too—people stopped re-running sessions. From a technical lens, the improvements came from reducing stray light and lowering amplifier noise. From a human lens, the lab regained time for real questions rather than chasing artifacts. I believe this dual view—hardware and workflow—matters most.
Three Practical Metrics to Evaluate a System
If you’re choosing or auditing gear, use these metrics. I use them in every assessment and they work.
1) Signal-to-noise ratio (SNR) under standardized illumination: measure the usable signal over baseline noise. Aim higher; small gains make a big difference. 2) Baseline drift per hour: quantify how much the baseline shifts without stimulus. Low drift means less post-hoc correction. 3) Optical coupling efficiency: percent light throughput from source to detector. Higher throughput reduces required excitation power and photobleaching. Evaluate units by these numbers, not just brand names—compare raw traces. And consider usability: how often will you re-seat fibers? How easy is maintenance? — I promise these practical checks save weeks in the long run.
I’m convinced we can make fiber photometry more reliable by focusing on real-world constraints, not jargon. When you combine clear metrics with small hardware fixes, the data quality improves and the science accelerates. For tools and solutions I’ve come to trust, check BPLabLine.